Internet Advertisements: What to Track and Why
01/27/2026

Most internet advertisements don’t fail because the targeting is wrong, they fail because teams can’t see what’s working (or they see it too late). When your reporting is built on incomplete conversion tracking, misattributed revenue, or inconsistent definitions, the result is predictable: spend moves based on opinions, not evidence.
This guide breaks down what to track in internet advertisements and why, so you can make faster decisions, defend budgets, and reduce the “we need more data” loop that stalls performance.
Start with three measurement layers (not “one dashboard”)
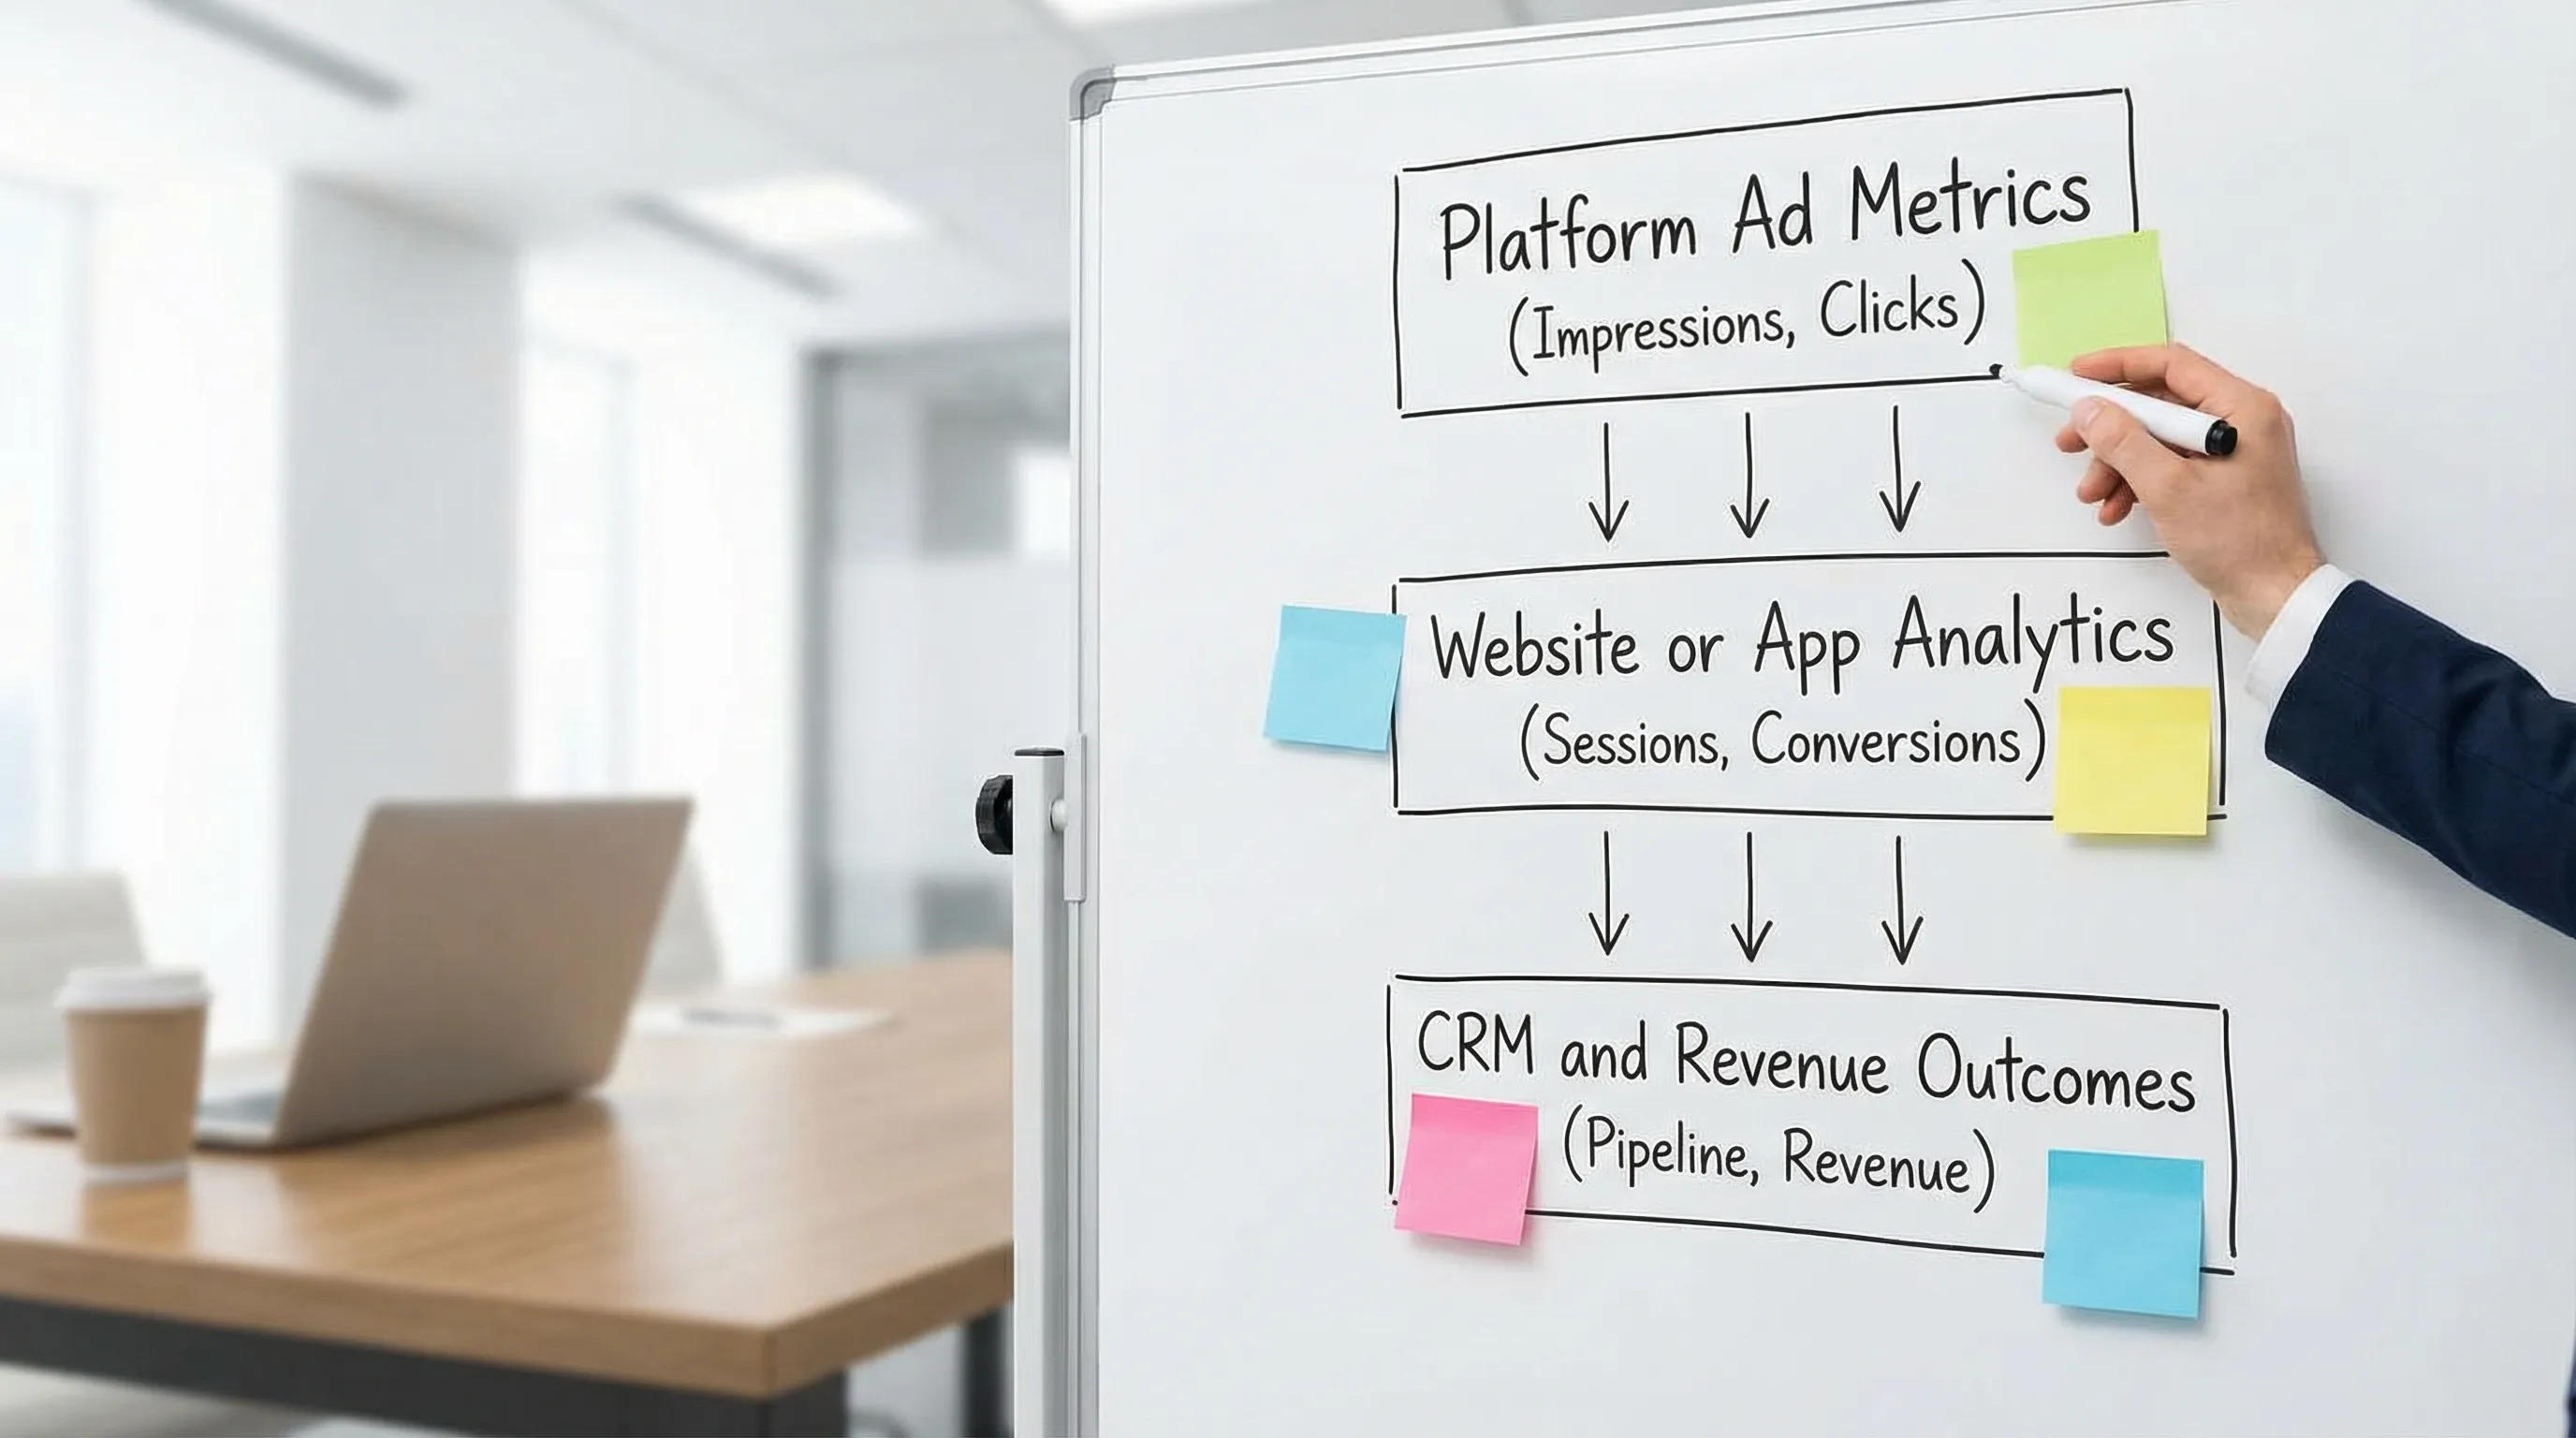
Tracking for internet advertisements works best when you separate metrics into layers, then connect them:
- Platform delivery metrics (Google Ads, Meta, LinkedIn, TikTok): What the algorithm is doing.
- On-site or in-app behavior (GA4, server events, product analytics): What users actually do after the click.
- Business outcomes (CRM, payments, subscriptions, pipelines): What the business gets paid for.
If your team only tracks layer 1, you optimize for cheap clicks. If you only track layer 3, you learn too late. The goal is a tight loop: platform signals inform decisions, but business outcomes validate them.
The core KPI set (by objective)
Internet advertisements are run for different jobs: awareness, lead gen, ecommerce, app installs, pipeline, retention. The best tracking frameworks pick one primary KPI, then a small set of diagnostic metrics that explain movement.
Here’s a practical mapping you can use across channels.
| Objective | Primary KPI (the “north star”) | Key diagnostic metrics (to explain why) | What it helps you decide |
|---|---|---|---|
| Awareness / demand creation | Reach in ICP (or target geography) | Frequency, CPM, video completion rate, brand search trend (directional) | Whether you’re buying unique attention or just repetition |
| Traffic / consideration | Qualified sessions | CTR, CPC, landing page view rate, bounce/engagement rate, time on page | Whether the click matches the message and the page |
| Lead generation | Cost per qualified lead (CPQL) | Form start rate, form completion rate, lead-to-MQL %, MQL-to-SQL % | Whether lead volume is real demand or junk |
| Ecommerce | MER or CAC (depending on maturity) | Conversion rate, AOV, refund rate, new vs returning mix | Whether growth is efficient, not just top-line |
| B2B pipeline | Cost per opportunity (or pipeline per $) | Meeting booked rate, opp creation rate, sales cycle length | Whether ads create pipeline that closes |
| Retention / upsell | Net revenue retention influenced | Repeat purchase rate, churn, cohort LTV, time to second purchase | Whether paid media compounds or leaks |
Tip: If you can’t define “qualified” (qualified session, qualified lead, qualified opportunity), you will end up optimizing internet advertisements for volume instead of value.
Track the funnel as ratios (so you can diagnose quickly)
Raw counts are useful, but ratios are where decisions come from. A simple funnel model for most internet advertisements looks like this:
- Impressions to clicks: Are we earning attention?
- Clicks to sessions (or landing page views): Are we losing users to slow pages, bad redirects, or tracking issues?
- Sessions to conversions: Does the offer and page work?
- Conversions to revenue (or pipeline): Are we attracting buyers or just browsers?
Here are the ratios worth standardizing across accounts.
| Funnel point | Metric | Why it matters | Common misread |
|---|---|---|---|
| Ad engagement | CTR | Fast check on message-market fit and creative relevance | High CTR can come from curiosity, not intent |
| Auction efficiency | CPC / CPM | Indicates how expensive it is to buy attention | A “good” CPC depends on downstream conversion rate |
| Click to site | Landing page view rate (where available) or click-to-session rate | Detects broken links, slow load, consent blockers, UTMs | Platforms can overcount clicks relative to analytics |
| Site conversion | CVR (conversion rate) | Shows offer/page effectiveness | CVR is meaningless if conversion tracking is wrong |
| Unit economics | CAC, ROAS, MER, pipeline per $ | Confirms the business outcome | ROAS can be inflated by last-click attribution |
The two “adult supervision” metrics: CAC and payback
If you’re running performance-focused internet advertisements, make sure leadership can answer:
- What is our blended CAC (or CPQL/CP opportunity) by channel?
- What is the payback period (or LTV:CAC) for customers acquired from paid media?
These force alignment between marketing and finance and prevent optimizing for platform-native metrics that do not translate into profit.
Track attribution with humility (and an escalation path)
Attribution is where teams lose weeks. The best approach is to:
- Pick a default attribution view for weekly decisions.
- Add a second view for sanity checks.
- Use incrementality tests when spend is meaningful or stakeholders disagree.
What to track for attribution (practically)
You don’t need every model. Track these consistently:
- Platform-reported conversions and value (good for optimization, not truth).
- Analytics-attributed conversions and value (good for cross-channel consistency).
- CRM or payment system source of truth (good for finance and long-term decisions).
Then track the gaps between them over time. Large swings often indicate:
- Consent mode and cookie loss changes
- Pixel vs server event mismatch
- Offline conversion import failures
- Broken UTMs or channel grouping changes
When to invest in incrementality
Incrementality is how you answer: “Would this have happened anyway?” It becomes important when:
- You’re scaling spend and ROAS is trending down
- Branded search or retargeting looks “too good”
- Executives question whether ads are creating new demand
Common approaches include geo-based holdouts and conversion lift tests, depending on platform and scale.
Track creative performance as a lifecycle, not a winner list
Creative drives most performance volatility in internet advertisements, especially in social and short-form video. Track it like an asset portfolio.
Creative metrics to monitor
- Spend concentration: How much spend is going to the top 1 to 3 creatives?
- Creative fatigue: Frequency rising while CTR and CVR fall.
- Hook performance (video): 2-second and/or 3-second view rate and completion rate.
- Post-click alignment: Creative-level CVR and CPA, not just CTR.
A simple creative rule that holds in many accounts: if a creative has great CTR but poor CVR, you likely have a message match problem (the ad promises something the page does not deliver).
Track audience and account health (so the algorithm can actually help)
Most teams obsess over targeting options, but performance often hinges on account health signals the algorithm uses to predict outcomes.
What to track varies by platform, but the intent is consistent:
- Match quality and event quality (are events deduplicated, complete, and attributable?)
- Frequency and reach (are you saturating a small pool?)
- Conversion delay (are you judging performance too early?)
If you run lead gen, also track lead quality lag: the time from lead created to qualified (MQL/SQL). A channel that “looks expensive” on day 1 can be the best source of customers on day 30.
Track operational metrics that protect performance
This part gets ignored, but it’s often the highest ROI: measuring the system that produces measurement.
If your onboarding and access setup is messy, your internet advertisements will spend money before your tracking is trustworthy.
Track these operational KPIs:
| Operational KPI | Definition | Why it matters |
|---|---|---|
| Time to verified access | Time from contract signed to confirmed access across ad + analytics tools | Prevents launch delays and week-one chaos |
| Time to measurement-ready | Time until key events (leads/purchases) are firing and validated | Stops “optimizing” on broken signals |
| Permission correction rate | % of accounts needing rework due to missing roles/assets | Reveals process debt and security risk |
| Onboarding completion rate | % of clients who finish setup within SLA | Predicts time-to-first-campaign |
This is where a dedicated onboarding layer helps. Connexify is designed to streamline client onboarding for agencies and service providers with a single branded link that can set up secure, multi-platform access with customizable permissions (and options like white-labeling, API, and webhooks). The point is not just convenience, it’s eliminating the “measurement is broken because we’re still waiting on access” failure mode.
If your team is still collecting logins and IDs through email threads, your tracking will remain fragile.
Build a weekly “internet advertisements scorecard” that executives trust
A scorecard should answer three questions:
- Are we getting enough signal?
- Is efficiency improving or degrading?
- Is the business outcome healthy?
A practical weekly scorecard (for most agencies) includes:
- Spend
- Primary KPI (by objective: CPQL, CAC, ROAS, pipeline per $)
- Conversion volume (with a note if attribution changed)
- CTR, CPC/CPM, CVR
- New vs returning mix (or lead quality mix)
- Top 3 winners and top 3 losers (creative or campaign level)
- Tracking health notes (anything broken, delayed, or newly fixed)
Keep it stable for 8 to 12 weeks. When teams constantly change what they report, stakeholders stop believing all of it.
Don’t ignore skills: tracking improves when teams share a baseline
Many tracking problems aren’t technical, they’re definitional. For example, one person thinks a “conversion” is a form submit, another thinks it’s a qualified meeting, and the client thinks it’s revenue.
If you’re building capability in-house, consider standardizing training around analytics, cloud, and security fundamentals (especially if you rely on server-side tracking, APIs, and warehouse pipelines). For teams pursuing certifications, Planet Cert practice tests can help people prepare for common IT certification exams with realistic simulators and explanations.
A simple “what to fix first” priority order
When performance is unstable, fix tracking in this order:
1) Confirm the business outcome definition
Align on what “success” is (revenue, qualified pipeline, retained customers) and what counts as a valid conversion.
2) Validate measurement end-to-end
Make sure the event exists, is deduplicated where relevant, and arrives in the ad platform and analytics.
3) Fix funnel leaks before scaling spend
If click-to-session rate is low, fix page load and redirects. If CVR is low, fix the offer and page. If lead quality is low, fix intent filters and follow-up speed.
4) Only then optimize the algorithm
Bidding strategies, audience expansion, and budget scaling work best when the signal is clean.
Where Connexify fits (without overcomplicating your stack)
If you’re trying to improve what you track in internet advertisements, you typically run into an unglamorous blocker: clients cannot (or will not) grant access quickly, and tracking setup drags on for days.
Connexify addresses that operational gap by giving you a streamlined onboarding workflow with:
- One-link client onboarding
- A branded onboarding experience (with white-label options)
- Support for multiple platforms
- Customizable permissions
- API and webhook integrations
- Secure data handling
- No installation required
- A 14-day free trial
The practical result is faster time-to-verified-access and faster time-to-measurement-ready, so your reporting improves because your underlying setup is consistent.
If you want to remove access friction and launch tracking cleanly, you can explore Connexify at Connexify.io and book a demo to see how the one-link onboarding flow works in your environment.